
The Cost of a Bad Hire for a Small Business: Benchmarks and a Worked Example
The cost of a bad hire includes the recruitment work you repeat, avoidable training and management time, and the gap between expected and delivered work. There is no single percentage of salary that accurately prices all of those costs for every small business.
Published hiring and turnover benchmarks give useful context, but they measure different things. A recruitment fee, a replacement budget, and the cost of underperformance are not interchangeable. None establishes a minimum loss for your particular hire.
For an owner without an HR team, the more useful number comes from the work and money tied to the specific hire. The calculation below shows how to estimate it without treating every pound of salary as wasted or counting the same loss twice.
What the Published Cost Figures Actually Measure
| Source | Published finding | How to use it |
|---|---|---|
| SHRM, 2025 | Average cost per hire: US$5,475 nonexecutive; US$35,879 executive. | A recruiting benchmark, not the total cost of underperformance or an estimate specific to small businesses. |
| Gallup, 2019 | Estimated replacement cost: 50%–200% of annual salary. | Context for employee turnover, not proof that every unsuccessful hire costs this amount. |
SHRM's survey received 2,371 responses from U.S. members across industries and organisation sizes. The data were unweighted and response counts differed by metric. Gallup's range is a broad estimate in an article about U.S. voluntary turnover, not a small-business cost survey. Use both as reference points; use your own records for a budget.
The often-repeated claim that the U.S. Department of Labor sets a 30%-of-salary minimum is excluded here because we could not verify a primary DOL source for it. A widely repeated attribution is not enough to establish a reliable benchmark.
Where the Cost Actually Comes From
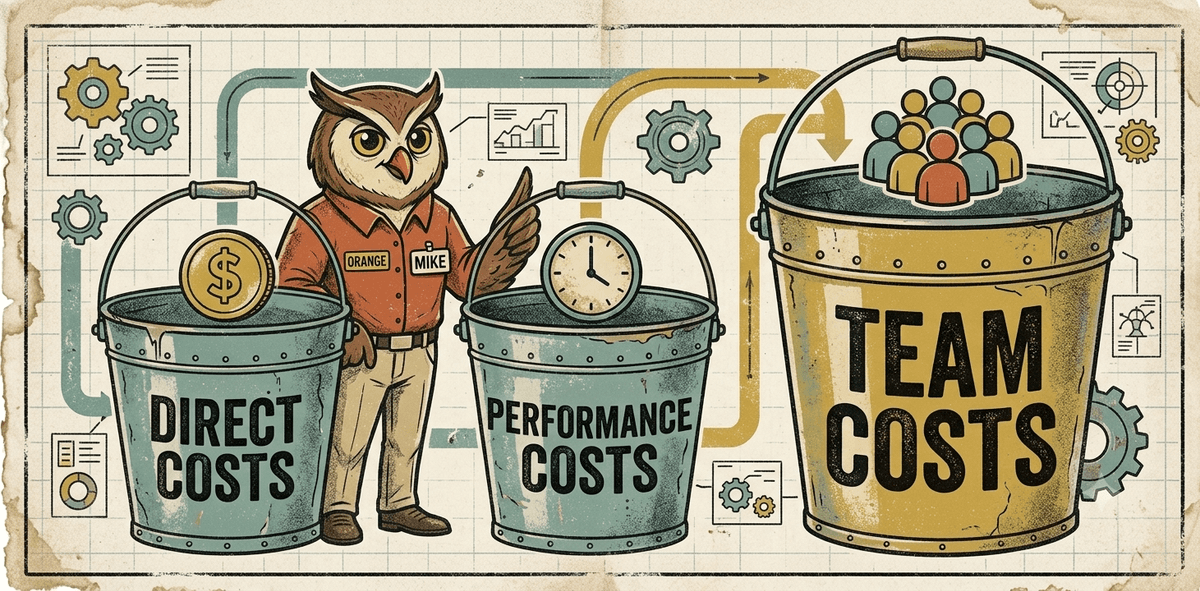
Track three categories separately: direct spending, lost productive capacity, and effects on the wider team. Their relative size depends on the role and what happened; team costs are not automatically the largest.
Direct Costs: What You Can See on a Spreadsheet
Start with invoices: advertising, agency fees, external training, and any actual exit-related costs. Track time spent reviewing applications and conducting interviews separately at an explicit hourly rate. A staff hour has a cost, but reclaiming that hour does not necessarily reduce payroll spending.
Distinguish the original hiring investment from the additional cost caused by the hire failing. The original recruitment and normal onboarding would also have happened with a successful hire. Including them can show total investment in the unsuccessful hire, but they should not automatically be labelled additional loss.
Performance Costs: What You Can Feel But Not Always Measure
Log additional correction, supervision, and rework hours beyond normal onboarding. For an illustrative case, three extra management hours a week for 20 weeks at £40 an hour equal £2,400. Those are assumed inputs, not a measured average for managers.
Salary paid is also different from value lost. A £28,000 annual salary costs approximately £11,667 over five months before employer on-costs. If the employee delivered useful work during that period, treating the entire salary as a loss overstates the problem. Estimate the shortfall against reasonable expectations for someone at that stage of onboarding.
You can use a share of employment cost as a rough proxy for that shortfall, or use documented operational losses. Do not add a salary-based proxy to missed revenue or rework that represents the same missing output. Where the financial impact is uncertain, show a range.
Team Costs: Work Shifted to Everyone Else
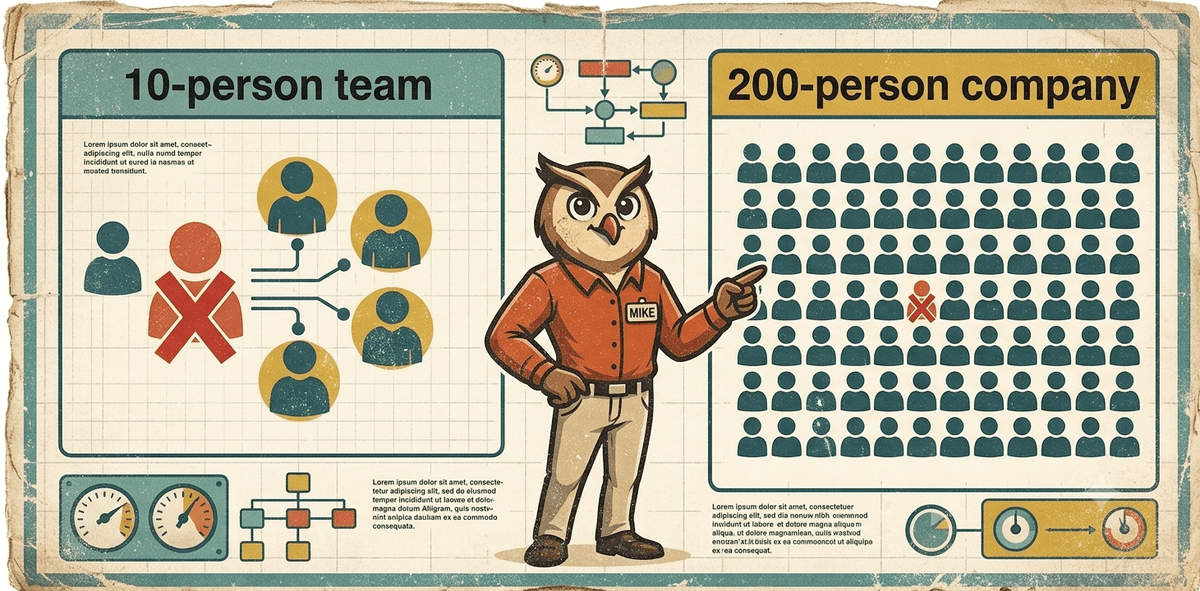
Team size helps explain why the same vacancy or performance gap can feel different across businesses.
One employee represents 0.5% of a 200-person organisation and 10% of a ten-person team. That is a headcount calculation, not a measurement of productivity loss. A specialist in a large business may still be a critical dependency.
Track overtime, redistributed tasks, delayed customer work, and changes in workload. If another employee leaves, record that as a separate turnover event and investigate the reasons rather than assuming one colleague caused it.
HireMike Insight
A cost log needs a column for who absorbed the extra work. Ten hours of correction spread across an owner and two colleagues can disappear from the calculation if only the owner's calendar is counted. Keep those hours separate from the original interview and onboarding time.
Gallup reported in 2019 that 52% of employees leaving voluntarily said their manager or organisation could have taken action to prevent their departure. That finding supports checking in with the team; it does not measure the probability that a bad hire will cause a colleague to resign.
A Worked Cost Calculation for a Small Business
This is an illustrative scenario in GBP, not a survey result or a typical minimum. Assume a £28,000 salary, five months in the role, and a 50% output shortfall relative to reasonable expectations during that period. Use salary as a rough proxy for output value. All fees, hours, and rates below are example inputs.
| Additional cost caused by the failed hire | Calculation | Amount |
|---|---|---|
| Output shortfall, using salary as a proxy | £28,000 ÷ 12 × 5 × 50% | £5,833 |
| Extra management time beyond normal support | 3 hours/week × 20 weeks × £40/hour | £2,400 |
| Replacement advertising and selection | £600 advertising + 20 hours × £40/hour | £1,400 |
| Repeated external training and colleague onboarding time | £500 training + 20 hours × £30/hour | £1,100 |
| Estimated additional cost | Rounded to the nearest pound | £10,733 |
That is approximately 38% of the assumed £28,000 annual salary. Changing only the output-shortfall assumption to 25% produces about £7,817; changing it to 75% produces £13,650. Those results demonstrate how sensitive an estimate is to its assumptions. They are not a market-wide cost range.
The example excludes employer on-costs, temporary cover, exit-related costs, customer losses, and further turnover. Add those only where they apply and are not already represented. It also excludes the original recruitment and normal onboarding investment so that the total measures additional cost rather than all spending associated with the employee.
To build your own estimate, log dates, actual spending, and hiring hours by stage. Record uncertain output losses separately from amounts supported by invoices or timesheets.
HireMike Insight
Separate spending you can verify from losses you are estimating. A replacement advertising invoice is a fact; a 50% output shortfall is an assumption until supported by work records. Keeping both visible makes the total useful without pretending it is more precise than the evidence allows.
The Process Failures You Can Reduce
A hiring decision can go wrong because of unclear role requirements, weak assessment, poor onboarding, inadequate support, or changes in the job itself. A selection process cannot prevent every one of those problems. It can make the evidence behind the decision more consistent and easier to review.
The hiring manager sees twelve CVs and shortlists three. The three interviews happen across two weeks, with different questions emerging from different conversations. At the end of the process, the hiring manager is choosing between their memory of how each candidate came across, not between the candidates themselves. One felt confident. One seemed like a good cultural fit. One had slightly better experience on paper but came across as less engaged in the interview.
None of these are bad observations. They are simply not enough to make a reliable decision. And when the decision turns out to be wrong, the retrospective question, "what did we miss?", is almost impossible to answer, because there is no structured record of what each candidate was actually assessed against.
The U.S. Office of Personnel Management's structured interview guidance describes using a fixed sequence of questions and common scoring standards. That gives you a record of comparable answers. It does not guarantee that a hire will succeed or remove the need to check whether the role and onboarding are working.
What a Prevention-Focused Process Looks Like
Set evaluation criteria before reviewing applications, then check performance after the hire. SHRM's 2025 benchmarking release found that only 20% of organisations tracked quality of hire. For a small team, an initial approach is to record the role's expected outcomes and review progress at 30, 60, and 90 days. That review schedule is a practical suggestion, not a SHRM standard.
Concretely, a prevention-focused process includes three things:
Defined competencies before the process opens. Not a job description with a list of responsibilities, but a set of four to six specific capabilities that determine success in this role, identified before any applications are reviewed.
Structured, consistent evaluation. Every candidate assessed against the same questions in the same order, with responses scored against a rubric defined before any interviews take place. The output is comparable data, not impressions.
A ranked shortlist based on evidence. The decision between final candidates is made using structured evaluation data rather than memory. When two candidates feel similar, the scorecard distinguishes them, which is the moment the structure earns its place.

Where HireMike Fits
HireMike builds structured screening into the first round of every hiring process automatically. When a role goes live, every applicant is assessed against the same criteria in the same format, scored against a consistent rubric, and ranked by the output. The hiring manager receives a shortlist of the strongest candidates with comparable evaluation data behind each one, not a pile of CVs and a set of varying impressions from conversations that went in different directions.
Review the shortlist and underlying evidence before deciding whom to advance. Compare the cost of screening with the time your process requires, but do not treat the worked example as a saving HireMike guarantees. The cited research does not measure HireMike's effect on unsuccessful hires.
The Number to Keep in Mind
In the illustrative case above, the estimated additional cost is £10,733, including an assumed output shortfall. Your figure may be lower or higher. The useful next step is to build a cost log, define what successful performance looks like, and use the same criteria when comparing candidates and reviewing the hire.
Sources and Calculation Notes
- SHRM's 2025 benchmarking release, 15 October 2025: U.S. cost-per-hire figures, quality-of-hire measurement, and survey methodology.
- Gallup: This Fixable Problem Costs U.S. Businesses $1 Trillion, 13 March 2019: employee replacement cost estimate and voluntary departure findings.
- OPM's structured interview guidance: consistent questions and scoring standards.
Sources checked 5 September 2026. U.S. benchmarks retain their original currency and population. The GBP example is an independent illustration, not a currency conversion or a HireMike customer result. Totals use unrounded inputs and are rounded to the nearest pound for display.