
How to Measure Quality of Hire: Formula, Scorecard and Example
Quality of hire measures how well a hiring decision produces the results the role was created to deliver. To measure it, score job performance, time to productivity, adaptive and team contribution, and retention on a common 0–100 scale. Set the weights before reviewing the results, then compare only similar hires over the same period.
It is not a measure of a person's worth, and it is not an interview score. It is a post-hire outcome shaped by selection, onboarding, management, resources and the working environment.
There is no universal quality-of-hire formula that fits every organisation. The useful goal is not to manufacture one impressive number. It is to build a consistent feedback loop between the evidence collected before a hire and the results observed afterwards.
In brief:
- Measure outcomes after the person has had a fair opportunity to perform.
- Use several job-related measures rather than retention or manager satisfaction alone.
- Keep pre-hire scores separate from the outcome they are meant to predict.
- Show the component scores, sample size and missing data beside the total.
- Use the result to improve the next hiring process, not to assign blame for the last one.
What is quality of hire?
Quality of hire is the value a new employee delivers after joining a business, measured against the outcomes and behaviours required for that particular role.
Before the hire, an employer has evidence and predictions:
- Structured interview scores
- Work-sample results
- Relevant skills and experience
- Job-knowledge assessments
- Reference information
After the hire, the employer has outcomes:
- Performance against agreed role objectives
- Time taken to work independently
- Ability to learn and respond to change
- Job-related contribution to the team
- Retention after a defined period
That separation is important. An interview score is intended to predict what happens later. If the interview score is included inside the quality-of-hire result, then used to prove that the interview works, the logic becomes circular.
Quality of hire should help answer a more useful question:
Did the evidence we collected before hiring help us identify people who later succeeded in this role?

Pre-hire scores are predictors. Quality of hire is the later outcome used to test those predictions.
Why measure quality of hire?
Most recruitment metrics stop before the work begins.
Time to fill records how quickly a vacancy was filled. Cost per hire records what the recruitment process cost. Offer acceptance records whether candidates accepted. The interview-to-hire ratio shows how many interviewed candidates were needed to produce one hire.
Those are useful efficiency measures. None of them shows whether the person eventually performed well.
In its 2025 recruiting benchmark, SHRM reported that 20% of the organisations it surveyed measured quality of hire. The finding comes from a US survey of SHRM members, not a global census, but it illustrates the measurement gap: many organisations can describe the cost and speed of hiring more easily than its eventual result.
A practical quality-of-hire measure can help a business:
- Test whether interview evidence is associated with later performance
- Identify questions or assessments that add little useful signal
- Compare sourcing channels using outcomes rather than application volume
- Distinguish a selection problem from an onboarding problem
- Improve role definitions and evaluation criteria
- Give interviewers feedback grounded in later results
- Balance hiring speed and cost with hiring effectiveness
This matters particularly to a small business. One unsuccessful appointment can affect customer relationships, management time and the rest of a small team. A separate guide explains how to estimate the cost of an unsuccessful hire, but cost is only one consequence. Quality-of-hire measurement supplies the evidence needed to learn from the outcome.
Why there is no single universal formula
Quality of hire is difficult to standardise because success looks different across jobs.
A customer support employee may be judged on resolution quality, response times and escalation judgement. A salesperson may be judged on qualified pipeline, revenue and forecast accuracy. An operations employee may be judged on throughput, error rates and service levels.
The Society for Industrial and Organizational Psychology recommends using multiple measures, tracking results over time, accounting for the context of the job and checking outcomes for fairness. That is more defensible than selecting one convenient metric and calling it quality.
Retention alone is not enough. A person can remain employed while performing poorly, and a strong employee can leave because of relocation, compensation, management or personal circumstances.
Hiring-manager satisfaction alone is not enough either. It can be useful, but it may reflect unclear expectations, recency, similarity or one memorable incident. A manager's rating becomes more useful when it is anchored to observable outcomes and behaviours.
The answer is not to abandon the metric. It is to define what the score includes, what it excludes and how it should be interpreted.
A practical quality of hire formula
For one employee, a practical starting formula is:
Quality-of-hire score = (0.50 × P) + (0.20 × T) + (0.20 × A) + (0.10 × R)
Where every component is normalised to a score from 0 to 100:
- P = Role performance
- T = Time to productivity
- A = Adaptive and team contribution
- R = Retention at the chosen measurement point
The weights add to 100%. This example gives the greatest weight to performance because delivering the role's intended results is the central outcome. It gives retention less weight because continued employment has several possible causes and does not prove strong performance by itself.
These weights are illustrative, not an industry standard. A care role, sales role, engineering role and warehouse role may need different measures or weights. Agree on them before the recruitment process begins. Changing the formula after seeing who scores well turns measurement into justification.
The score should be called an index out of 100, not “86% quality”. It is a summary of the components the organisation selected, not a percentage of a person's total value.
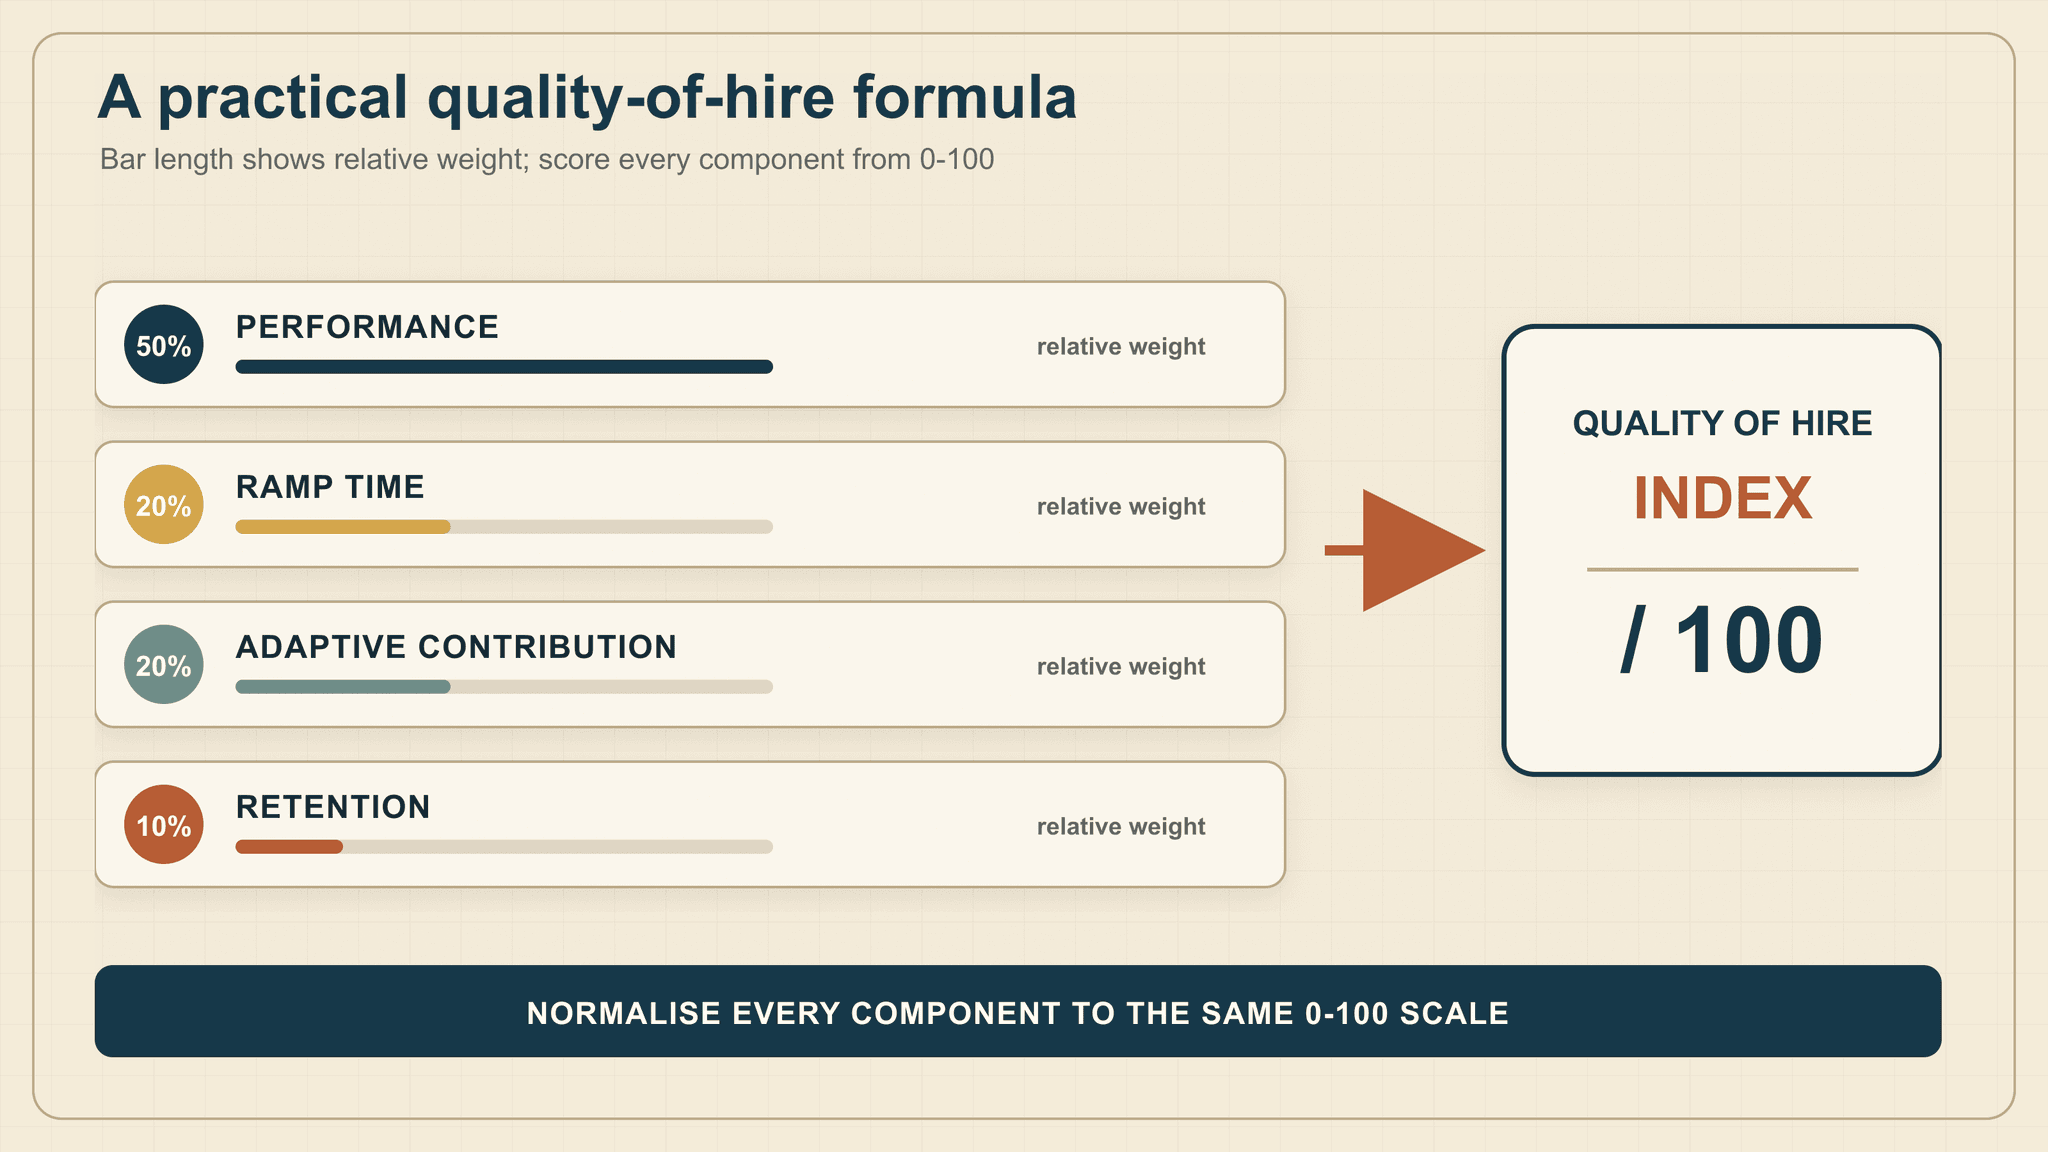
The weighting makes performance primary while keeping the other outcomes visible.
Which quality of hire metrics belong in the scorecard?
| Component | Example weight | How to measure it | Suggested review point |
|---|---|---|---|
| Role performance | 50% | Progress against three to five outcomes defined for the role | Six and 12 months |
| Time to productivity | 20% | Actual ramp time compared with the target set before the hire starts | When independent proficiency is reached |
| Adaptive and team contribution | 20% | Behaviourally anchored evidence of learning, judgement, collaboration and response to change | Six and 12 months |
| Retention | 10% | Whether the employee remains at the predetermined milestone, with the exit reason recorded separately | 12 months |
The total is only the summary. Always keep these component results visible beside it. Two people can have the same total for very different reasons, and those differences determine what the business should improve.
1. Role performance score
Start by defining the outcomes the role must produce. Choose three to five results that can be observed consistently and that genuinely matter to the business.
For a customer support specialist, the measures might include:
- Resolution quality
- Customer satisfaction
- Reopened-ticket rate
- Response-time compliance
- Accurate escalation of complex cases
For each measure, describe the minimum acceptable result and what stronger performance looks like. Convert the combined assessment to a 0–100 score using the same method for every comparable employee.
Do not ask only, “How happy are you with this hire?” That question encourages an overall impression. Ask what the employee delivered against criteria established before they were selected.
The CIPD's performance guidance distinguishes task performance, contextual performance and adaptive performance. This is useful because someone may deliver assigned work well while struggling to adapt, or contribute effectively to the team before reaching full individual productivity.
2. Time-to-productivity score
Define “productive” in observable terms, then set an expected ramp period before the employee starts.
For example, a support specialist might be considered independently productive when they can handle the normal case mix within agreed quality limits without routine intervention.
One simple conversion is:
Time-to-productivity score = the lower of 100 or (target ramp days ÷ actual ramp days) × 100
If the target is 60 days:
| Actual ramp time | Calculation | Score |
|---|---|---|
| 60 days | 60 ÷ 60 × 100 | 100 |
| 75 days | 60 ÷ 75 × 100 | 80 |
| 120 days | 60 ÷ 120 × 100 | 50 |
The cap prevents an unusually fast ramp from overwhelming all other measures. It also means the formula treats anyone meeting or beating the target as fully successful on this component.
Interpret the result carefully. A delayed laptop, absent manager, missing documentation or disrupted training plan can extend ramp time. That is information about the employment system, not automatically evidence of a poor hiring decision.
3. Adaptive and team-contribution score
Avoid a vague “culture fit” rating. It can easily become a judgement about familiarity, personality or personal similarity.
Use observable, job-related behaviours instead. Depending on the role, these might include whether the employee:
- Learns from feedback
- Adjusts when priorities change
- Raises problems early
- Shares useful knowledge
- Works constructively with colleagues
- Makes sound decisions without unnecessary supervision
Write rating anchors before collecting the data. A five-point scale can be converted to 0–100 with:
Adaptive contribution score = ((average rating − 1) ÷ 4) × 100
This converts a rating of 1 to 0, a rating of 3 to 50 and a rating of 5 to 100.
The anchor matters more than the number. “Excellent attitude” is subjective. “Identifies a delivery risk early, explains its likely effect and proposes a workable response” describes behaviour another reviewer can recognise.
Where practical, use more than one evidence source. Manager feedback, relevant work results and structured peer input can reveal different parts of performance. More raters do not automatically remove bias, but multiple specific observations are usually more informative than one general opinion.
4. Retention score
For a 12-month measurement window, the simplest individual retention score is:
- 100 if the person remains employed at 12 months
- 0 if the employment relationship ended before 12 months
Record the reason separately. A resignation caused by relocation, a redundancy and an exit following poor performance should not be interpreted as the same event.
For a group of hires, report the underlying rate as well:
12-month retention rate = eligible hires still employed at 12 months ÷ all hires that reached or exited before their 12-month point × 100
Do not remove early leavers because they have no later performance review. That creates survivor bias by making the remaining group appear more successful. Instead, plan an exit assessment where possible and disclose any missing outcomes beside the cohort result.
Retention can highlight a problem, but it cannot identify the cause by itself. Management, compensation, workload, role design, career opportunities and working conditions all affect whether someone stays.
How to calculate quality of hire: a worked example
Consider a hypothetical small business that hires Nia as a customer support specialist.
Before advertising the role, the company defines its performance outcomes and decides that an employee should reach independent proficiency within 60 days. It also agrees on the four measures and weights above.
After 12 months, Nia has these results:
| Component | Score | Weight | Weighted contribution |
|---|---|---|---|
| Role performance | 84 | 50% | 42.0 |
| Time to productivity | 80 | 20% | 16.0 |
| Adaptive and team contribution | 88 | 20% | 17.6 |
| Retention | 100 | 10% | 10.0 |
| Quality-of-hire index | 85.6 out of 100 |
The calculation is:
(84 × 0.50) + (80 × 0.20) + (88 × 0.20) + (100 × 0.10) = 85.6
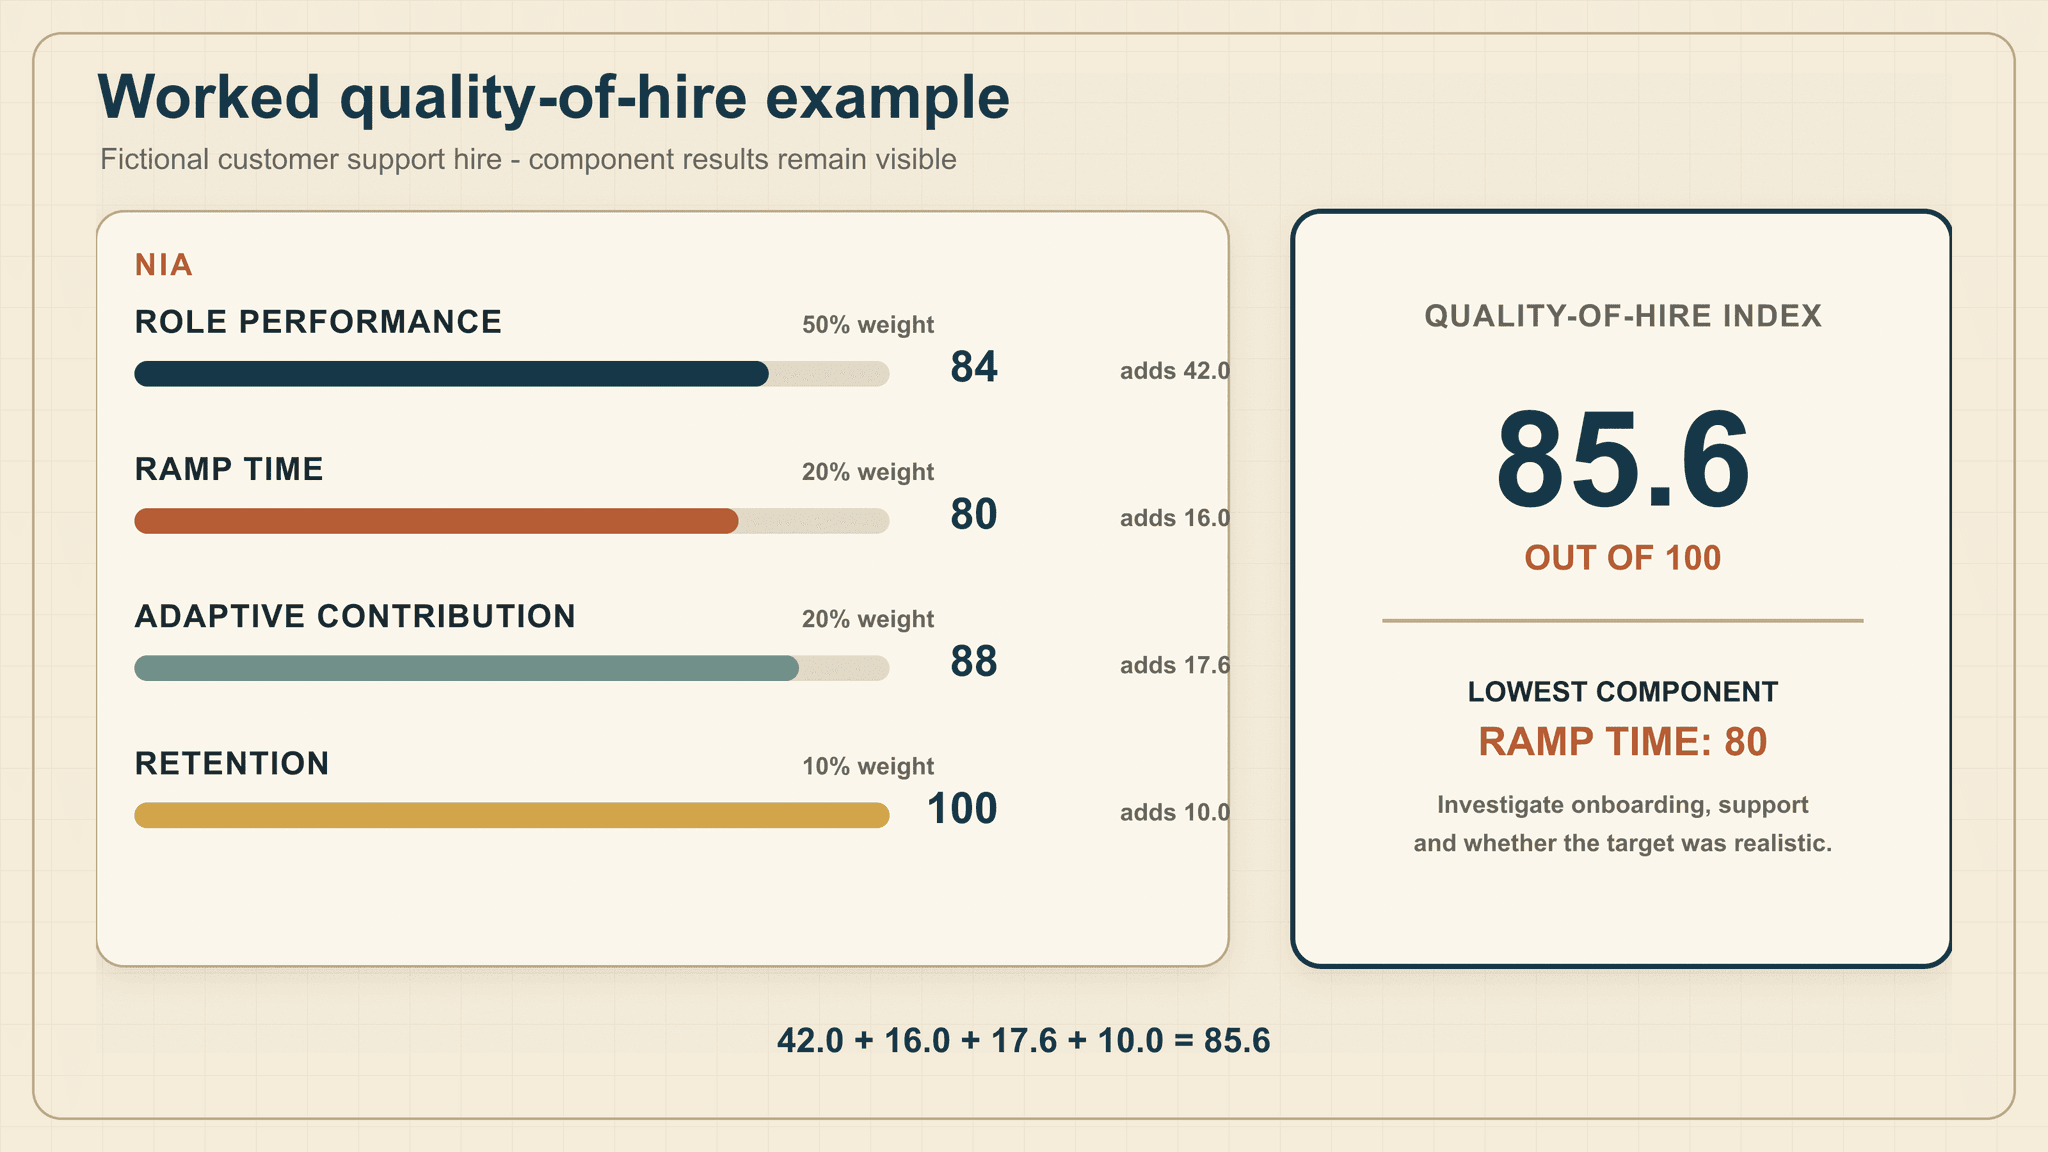
The composite answers “what was the overall result?” The four bars answer the more useful question: “what should we investigate?”
What does 85.6 mean?
It does not mean Nia is “85.6% good”, nor does it prove that every company should regard 85.6 as a strong score.
Under this employer's pre-agreed scorecard, the result means:
- Nia delivered the role's expected work at a high level.
- Her adaptive and team contribution was also strong.
- She remained through the 12-month review point.
- Her comparatively weak component was the speed of reaching full productivity.
That final point creates the most useful question. The employer should examine why ramp time exceeded the 60-day target:
- Was the target realistic?
- Did Nia receive the training that had been planned?
- Was her manager available?
- Did she wait for equipment, access or documentation?
- Do other high-performing hires also need approximately 75 days?
The total removes the arithmetic burden. The component breakdown supplies the meaning.
What counts as a good quality-of-hire score?
There is no credible global threshold that makes 80 “good” for every job and every organisation.
The useful comparisons are:
- The employee's result against criteria agreed before the hire
- One comparable hiring cohort against an earlier cohort
- The same role or job family over time
Do not compare a score of 78 for a junior support employee directly with 78 for a senior engineer when the roles use different outcomes, weights and ramp periods.
Instead of treating the total as a verdict, read the pattern:
| Result pattern | What it may indicate | What to investigate next |
|---|---|---|
| Strong performance, slow ramp | The person ultimately succeeded but took longer than expected | Ramp target, onboarding, manager availability and training resources |
| Strong retention, weak performance | Continued employment is masking a performance problem | Performance standards, feedback quality and management action |
| Strong manager rating, weak output | The subjective rating and observable results disagree | Rating anchors, recent-event bias and whether the right outcomes were selected |
| Weak results across several hires in one role | The problem may be systemic rather than individual | Role design, sourcing, selection, onboarding and working conditions |
| Interview scores and later results repeatedly disagree | The pre-hire process may be rewarding the wrong evidence | Questions, rubrics, interviewer calibration and work samples |
For a very small hiring cohort, show the individual components and avoid declaring a trend. One person is a case to understand, not a benchmark. As the sample grows, the organisation can establish its own role-specific distribution without pretending it is an external industry standard.
Choose the measurement window and cohort first
A result is only comparable when the people in it have had the same opportunity to produce the measured outcome.
Use a sequence rather than expecting one review to answer everything.
At 30 or 90 days
Review onboarding, role clarity, early behaviour and obstacles. Treat this as an early diagnostic, not a final quality-of-hire result.
At six months
Calculate provisional performance, ramp and adaptive-contribution results. Diagnose problems while there is still time to improve support.
At 12 months
Calculate the complete score, including the chosen retention measure. Use this result for cohort comparisons and hiring-process review.
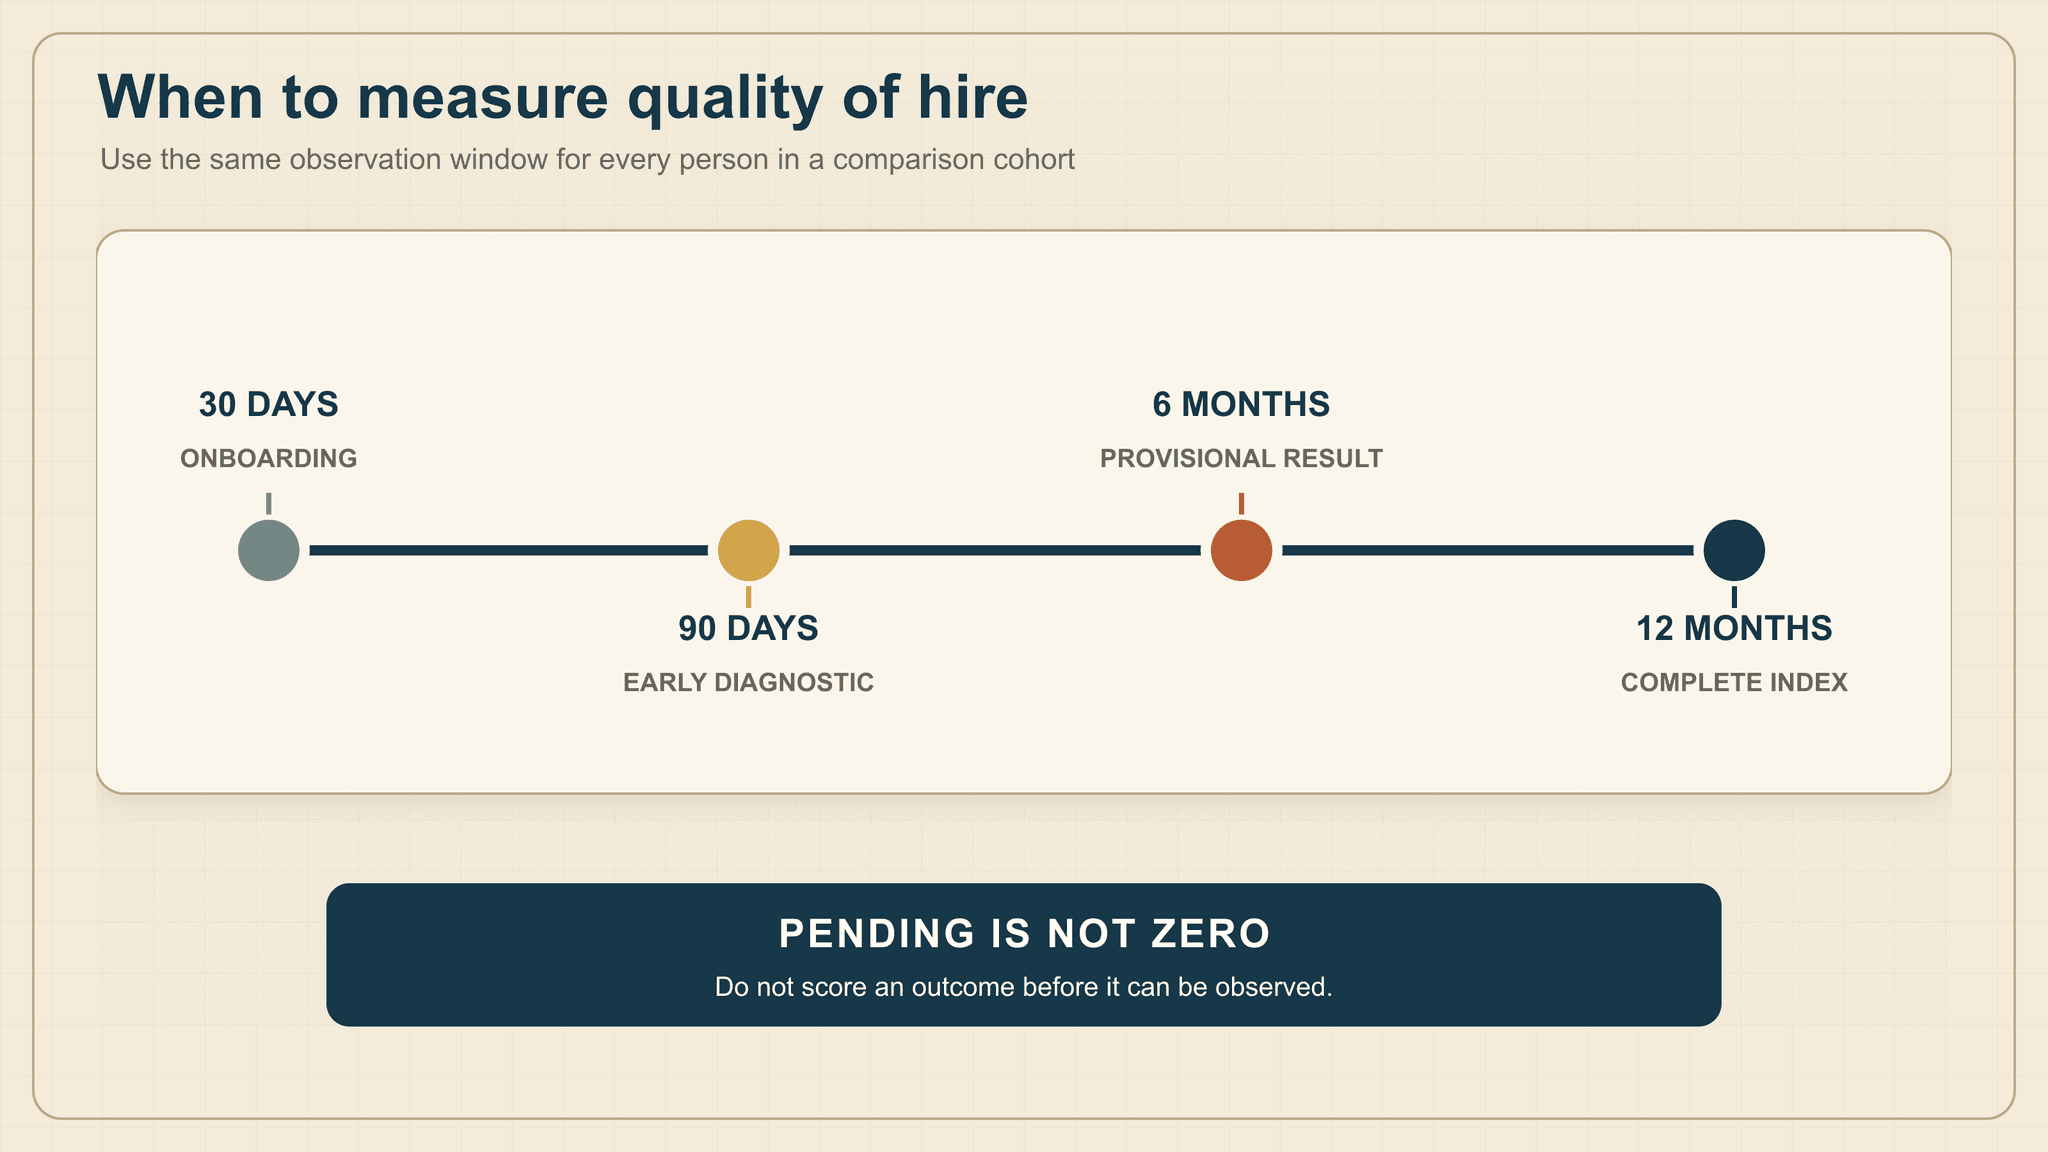
The important rule is simple: a pending result is not a zero.
Do not enter zero for a component that has not yet been observed. Mark it as pending. Otherwise, a recent hire will appear worse merely because they have not been employed long enough.
For every cohort report, state:
- The role or job family
- The hire-date range
- The observation window
- The number of eligible hires
- The number with complete scores
- Early exits
- Missing reviews or component data
- The exact formula and weights used
For employees with missing component data, do not silently redistribute the weights. Mark the individual score incomplete. If a cohort has material missing data, report the components and coverage rather than presenting a precise-looking composite that the evidence cannot support.
The cohort index, when every included person has a complete score, is:
Cohort quality-of-hire index = total of eligible individual scores ÷ number of eligible employees with complete scores
Show the completion rate beside that average. A high cohort score covering four of ten eligible hires should not be read like a score covering all ten.
How to use quality of hire to improve recruiting
The value of quality-of-hire measurement is not the dashboard. It is the feedback loop.
1. Start with the role outcomes
Define success before candidates are assessed. This prevents a persuasive applicant or a disappointing result from changing the standard after the fact.
2. Collect comparable pre-hire evidence
Use a consistent candidate evaluation process and an interview scorecard tied to the outcomes of the role. Record the evidence behind the rating, not only the rating itself.
3. Preserve the reasoning behind the decision
Document why the chosen candidate was selected, which trade-offs were accepted and what remained uncertain. This creates a fairer basis for later reviewing the original hiring decision.
4. Measure post-hire outcomes independently
At the agreed review points, measure performance, ramp, adaptive contribution and retention without importing the original interview score into the calculation.
5. Compare the predictor with the outcome
Keep the two datasets separate:
- Predictor: the structured interview, work-sample or assessment score
- Outcome: the later quality-of-hire score and its components
For a small business, a calibration table is a useful starting point:
| Pre-hire evidence | Post-hire outcome | Question to investigate |
|---|---|---|
| Strong | Strong | Which questions and examples provided the clearest signal? |
| Strong | Weak | Did the process reward interview polish rather than job evidence? |
| Weak | Strong | Did the rubric overlook an important capability or was it applied poorly? |
| Weak | Weak | Were warning signs recorded but ignored in the final decision? |
One hire cannot prove that a question works. Look for repeated patterns across people in comparable roles.
With a sufficiently large dataset, an analyst can examine the correlation between pre-hire scores and later outcomes. Sackett and colleagues' revised analysis of selection methods estimated the mean validity of structured interviews at approximately .42, with substantial variation between settings. That is a correlation, not 42% accuracy and not a guarantee. The design of the interview, the role, the scoring and the way it is administered all matter.
The US Office of Personnel Management's structured interview guidance similarly recommends building questions from job analysis, asking candidates consistent questions and scoring answers against common standards.
HireMike Insight:
A post-hire score should not be used to rewrite history. Preserve what the team knew, what it predicted and why it decided. Then compare that record with what actually happened. That is how a hiring process learns.
Common quality-of-hire mistakes
Treating retention as the whole measure
Someone staying for a year does not prove that they performed well. Someone leaving does not prove that they were a poor hire. Interpret retention beside performance and record the reason for departure.
Using hiring-manager satisfaction alone
Manager feedback is valuable, particularly early, but it can contain halo effects, recency and inconsistent expectations. Pair it with documented results and behaviourally anchored observations.
Putting the interview score inside the outcome formula
This makes it easier to “prove” that the interview worked because the predictor is embedded in the result. Keep pre-hire evidence and post-hire outcomes independent.
Measuring undefined culture fit
“Fits our culture” can easily mean “feels familiar”. Measure job-related behaviour and contribution instead.
Combining unlike roles or review periods
Ramp time and successful performance differ across roles, levels and teams. Do not mix 90-day, six-month and 12-month results or compare job families as if the standards were identical.
Hiding missing data
Removing early leavers or incomplete reviews makes the remaining group look artificially successful. Disclose what is missing and avoid a composite when the coverage is too weak to support one.
Blaming recruiting for every outcome
Post-hire results reflect selection, onboarding, training, resources, management and working conditions. Quality of hire is feedback about a system, not a recruiter-only performance rating.
Changing the formula after seeing the result
Choose the components, weights, eligibility rules and observation period in advance. If the method changes later, document the change and recalculate earlier comparisons where possible.
Fairness, privacy and responsible use
Quality-of-hire data can affect careers and contains sensitive performance information. Treat it accordingly.
Employers should:
- Collect only the information required for a defined purpose
- Restrict access to performance and demographic data
- Apply the same job-related scorecard to comparable employees
- Use behaviourally anchored criteria rather than personality impressions
- Examine whether different groups received comparable opportunities and ratings
- Investigate disparities without drawing conclusions from very small groups
- Provide reasonable accommodations where required
- Avoid using an automated score as the sole basis for an employment decision
- Follow the employment and data-protection rules that apply in their jurisdiction
In the United States, the EEOC's Uniform Guidelines explain how employers should consider job relatedness, validity and adverse impact in selection procedures. Requirements differ by location, so this article is general information rather than legal advice.
Where HireMike fits
HireMike cannot know that someone became a quality hire before that person has had a fair opportunity to perform the work. It does not replace post-hire performance data.
What HireMike can do is make the evidence collected before the decision more consistent and reviewable. Employers define the job criteria and approve the interview questions. HireMike conducts the structured first-round screening, then provides a criteria breakdown, highlights, recording and timestamped transcript for the hiring manager to review.
That gives the business a clearer pre-hire record to compare with later outcomes:
Role outcomes → structured interview evidence → human hiring decision → post-hire results → process improvement
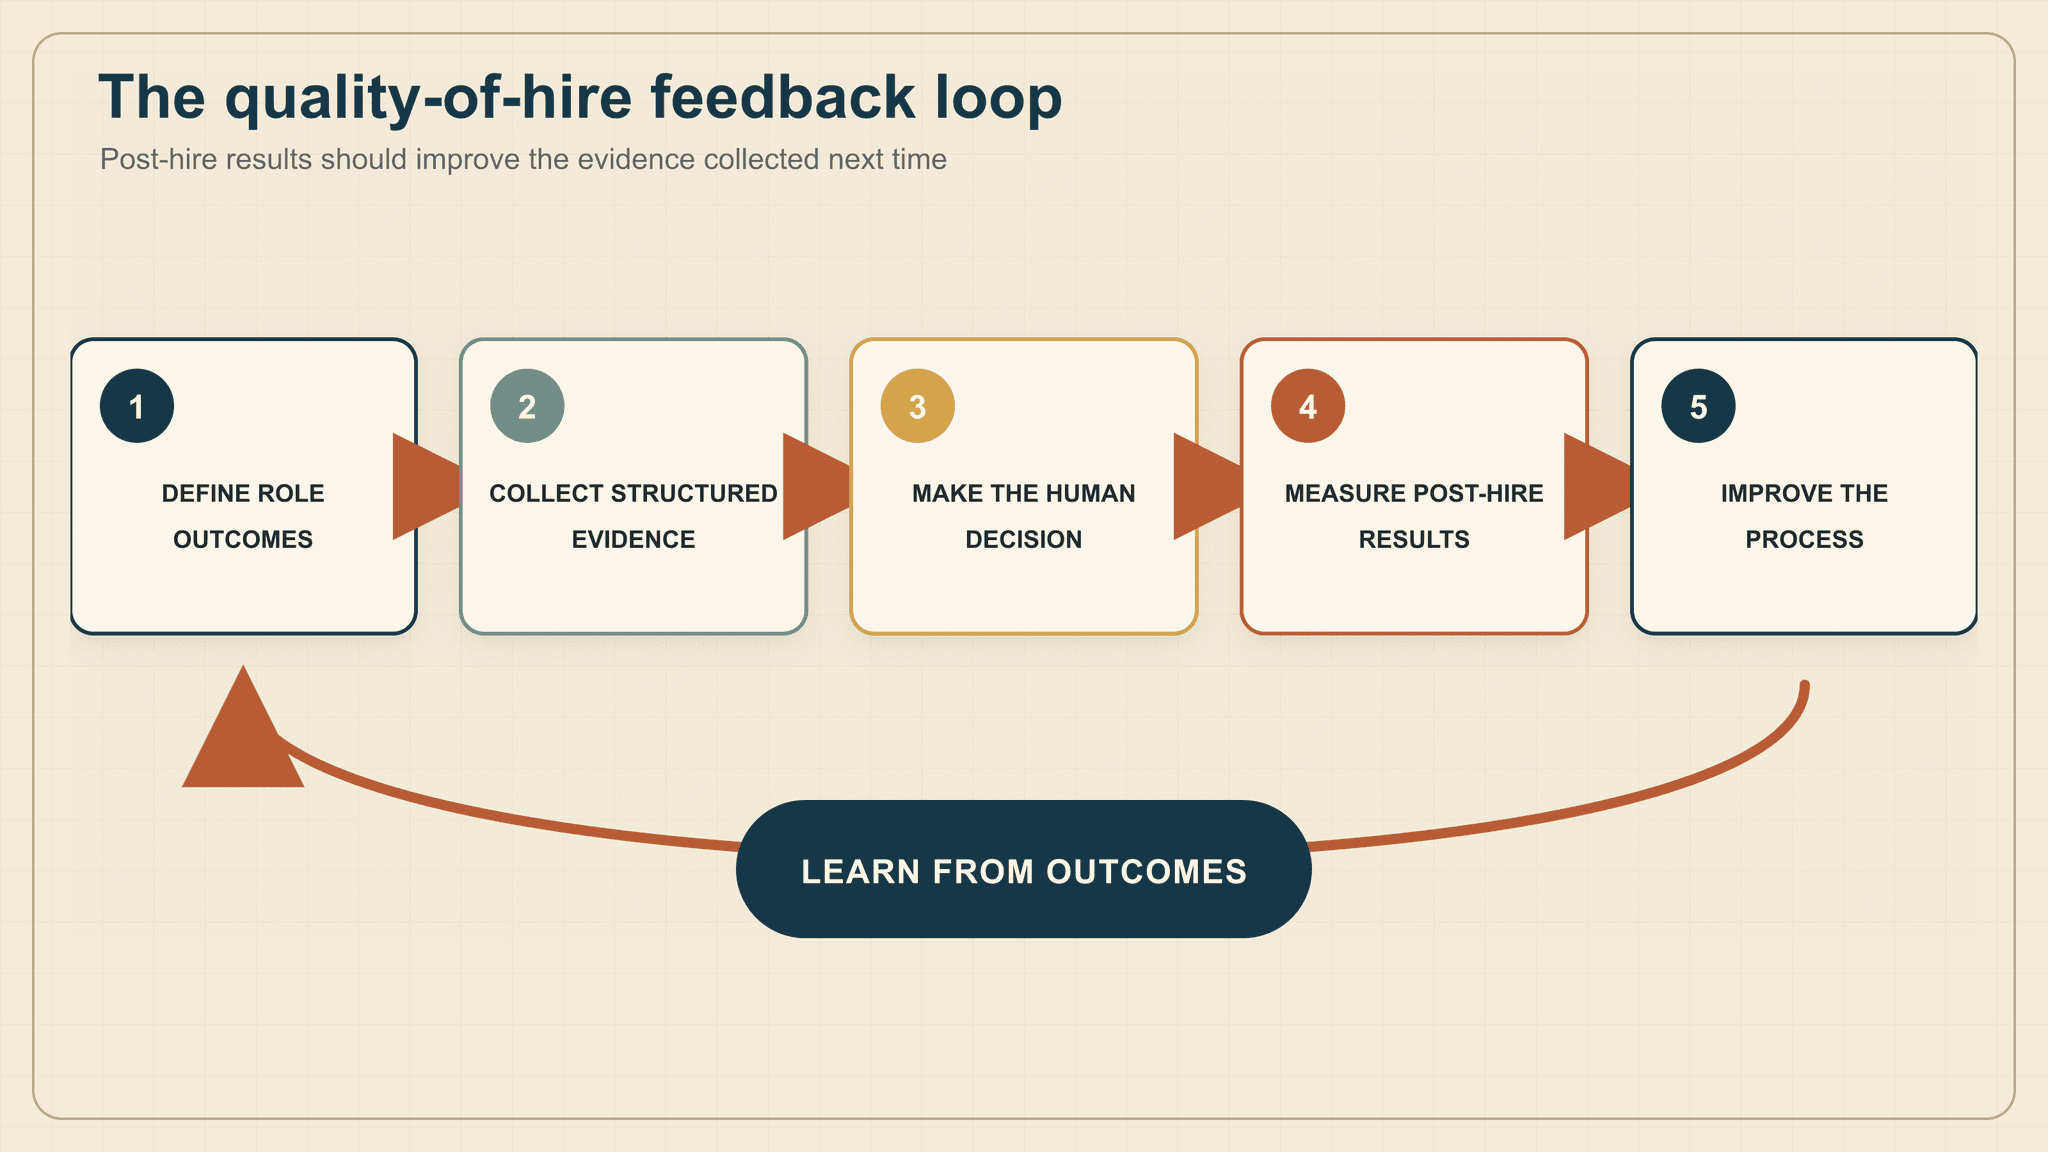
The loop closes only when later outcomes are used to improve the criteria and questions applied next time.
If candidates who provide strong job-related evidence repeatedly become strong employees, the process may be collecting useful signal. If polished interview performances repeatedly lead to weak outcomes, the team can identify which questions, criteria or scoring habits need to change.
See how HireMike structures first-round hiring evidence.
The purpose of measuring quality of hire is not to produce a flattering number or promise certainty. It is to make the next hiring decision better informed than the last.
Quality-of-hire checklist
Before the next vacancy is advertised:
- Define three to five outcomes that represent success in the role.
- Agree on the expected time to productivity.
- Choose the post-hire measures and weights.
- Write observable rating anchors.
- Define the eligible cohort and review dates.
- Decide how missing reviews and early exits will be reported.
- Use comparable questions and scoring for every candidate.
- Record the evidence behind the hiring decision.
- Review onboarding and obstacles at 30 or 90 days.
- Calculate a provisional result at six months.
- Calculate the full result at the chosen final milestone.
- Display every component beside the total.
- Compare pre-hire evidence with later outcomes.
- Improve the questions and rubric using repeated patterns, not anecdotes.
Frequently asked questions
What is the formula for quality of hire?
There is no universal formula. A practical starting index combines role performance, time to productivity, adaptive and team contribution, and retention after each component has been converted to a 0–100 score. Set the weights before reviewing the results and document how every component is measured.
How do you measure quality of hire?
Define success for the role, choose several post-hire outcomes, create consistent scoring rules, set a common observation period and calculate the result only for comparable employees. Show the component scores, sample size, missing data and formula beside the total.
When should quality of hire be measured?
Use 30- or 90-day reviews to diagnose onboarding and early obstacles, a six-month review for a provisional result and a 12-month review for a more complete outcome. The right final window depends on how long the role reasonably takes to demonstrate sustained performance.
What is a good quality-of-hire score?
There is no reliable global threshold. Compare the result with pre-agreed role standards and earlier cohorts in the same job family using the same formula and measurement period. For small samples, interpret individual components rather than claiming a trend.
Is retention the same as quality of hire?
No. Retention is one component. A retained employee may be underperforming, while a strong employee may leave for reasons unrelated to the original hiring decision. Read retention beside performance, ramp time and the reason for departure.
Can a small business measure quality of hire?
Yes. Begin with one role, three or four measures and a simple spreadsheet. Small samples will not support broad statistical claims, but a consistent record can still reveal onboarding problems, unrealistic ramp targets and mismatches between interview evidence and later performance.
Does quality of hire prove that an interview process works?
Not by itself. It supplies an outcome that can be compared with independently recorded pre-hire scores. Repeated association across comparable hires is more informative than one successful or unsuccessful employee, but correlation still does not prove that the interview caused the outcome.
Sources and calculation notes
- SIOP: Quantifying Quality — Best Practices for Measuring Quality of Hire: multi-measure, longitudinal, contextual and fairness considerations.
- SHRM 2025 Recruiting Benchmarking Report: US SHRM-member survey data on the use of quality-of-hire measures. Results are not presented here as global estimates.
- CIPD: Performance Management: task, contextual and adaptive dimensions of performance.
- US Office of Personnel Management: Structured Interviews: job analysis, consistent questioning and common scoring standards.
- Sackett and colleagues: Revisiting meta-analytic estimates of validity in personnel selection: revised validity estimates and variation between settings.
- EEOC: Uniform Guidelines questions and answers: US guidance on validity and adverse impact.
The formula, weights, fictional employee and worked figures in this article are illustrative. They are not an industry standard, customer result or claim that HireMike causes a particular hiring outcome. Sources checked 10 October 2026.